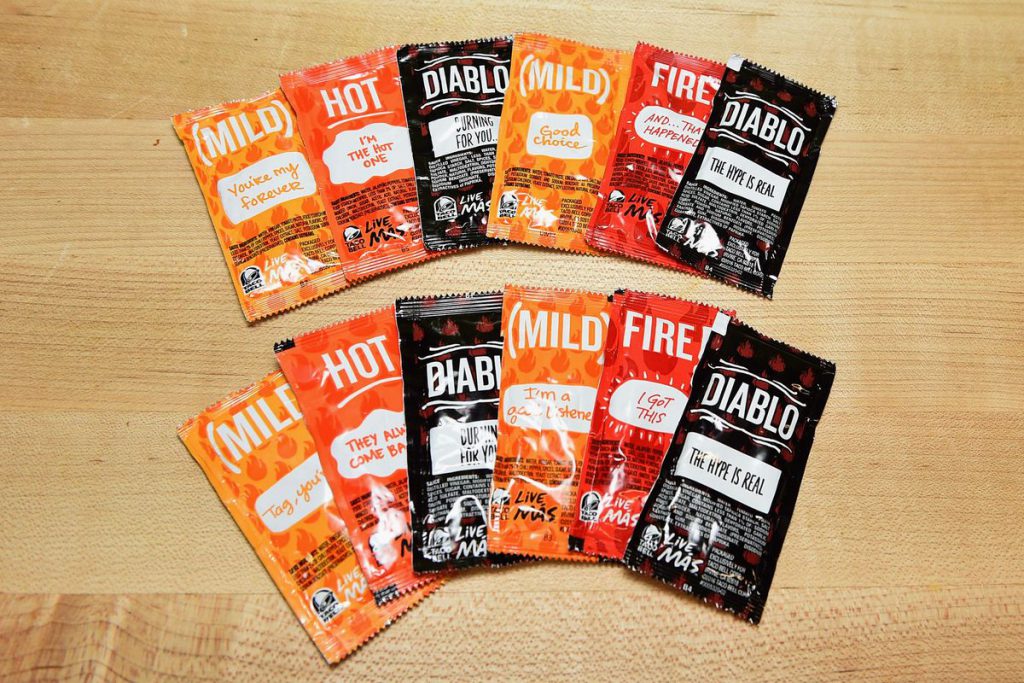
We all can (or should) agree that Taco Bell is the best fast food. When you take a trip to Taco Bell, they’ll inevitably ask if you would like any sauce. The best response: “surprise me.” The payoff? A heaping handful of sauce packets. But, are the flavors randomly distributed, or do they give you more of the extra hot (e.g., Diablo) sauce because they found the “surprise me” response annoying? Interesting question. To find the answer…statistics!
This activity (created by Dr. Jessica Hartnett) uses a chi-square to determine if the distribution of sauce packets was random. The activity comes with data students can enter, or ready made data sets. Of course, it would also be easy to have students do this on their own or with packets you bring to class.
You can find Jess’s description of the activity here.
In her blog post about it, she includes a link to a Time magazine article about the study, CSV and Excel versions of the dataset. Here is a blog post describing the activity. Also, here is a link to the original study in JPSP.
Please click here for the file.

