Spearman’s Correlation Explained
Jim Frost provides a thorough explanation of Spearman’s correlation, including when to use it, how it differs from Pearson’s r, and how it’s calculated. You can find the article here.
A meta-analysis looking at the correlation (or lack thereof) of self-report measures of media use and measures that track actual behavior. This would be useful to add to a discussion of types of measurement (contrasting the strengths and weaknesses of self-report and behavioral measures. Parry, D.A., Davidson, B.I., Sewall, C.J.R. et al. (2021). A systematic review and …
Article: Self-Report Vs. Behavioral Logs in the Measurement of Digital Media Use Read More »
Measures that use fewer than 10 items are considered “short” and pose some challenges, including concerns about validity. This special issue addresses several misconceptions about these scales and offers ways to counteract potential problems. Ziegler, M., Kemper, C. J., & Kruyen, P. (2014). Short scales – Five misunderstandings and ways to overcome them [Editorial]. Journal of …
Article: Misunderstandings about Short Scales and Ways to Address Them Read More »
An article by Christie Napa Scollon that outlines the basics of research designs in psychology, including information about experimental vs. correlational design. This reading would be a good introduction to the topic, or a good review for students who previously took a methods course. You can access the full chapter here.
Video (9:52) from Research by Design and Dr. Todd Daniel, described as follows, “Using the dataset we created in the first video, we now explore the relationship between our two scale-level variables: height and weight. We will use Pearson’s correlation to measure this relationship. We will also learn about a point biserial correlation with gender.” …
A brief (2:25) video from Pew Research Center in which, “The first video in Pew Research Center’s Methods 101 series helps explain random sampling – a concept that lies at the heart of all probability-based survey research – and why it’s important.”
Video (5:27) from Pew Research Center in which, “The second video in Pew Research Center’s “Methods 101” series helps explain question wording – a concept at the center of sound public opinion survey research – and why it’s important.”
Video (23:18) from Research by Design in which, “Exploring our data about burnout and job satisfaction, we predict an outcome with a single variable using simple linear regression in JASP. I explain how regression works, then open an SPSS dataset in JASP. We explore the assumptions of homoscedasticity and linearity with a scatterplot and normality …
Video: How to Do Simple Linear Regression in JAS Read More »
Video (18:47) from Research by Design in which, “Using a dataset about burnout and job satisfaction, we learn how to conduct a simple correlation, how to interpret it, and how to write it up in APA style. We begin by exploring the theoretical relationship among the variables to understand how correlation works. After we walk …
In this assignment (created by Dr. Kimberly A. Barchard and Dr. Leiszle Lapping-Carr), students learn how to calculate the Pearson Product-Moment correlation using SPSS and how to interpret the output. A detailed grading rubric is included. This assignment was designed to be completed with an existing dataset (the address is given on the assignment). The …
Online tutorial that guides students through a research study and data analysis using regression. There are 4 modules total, with the first three being most appropriate for an introductory course. Module 3 is short and could be used as an in-class demonstration. Module 4 is more advanced. During the tutorial students will start with a …
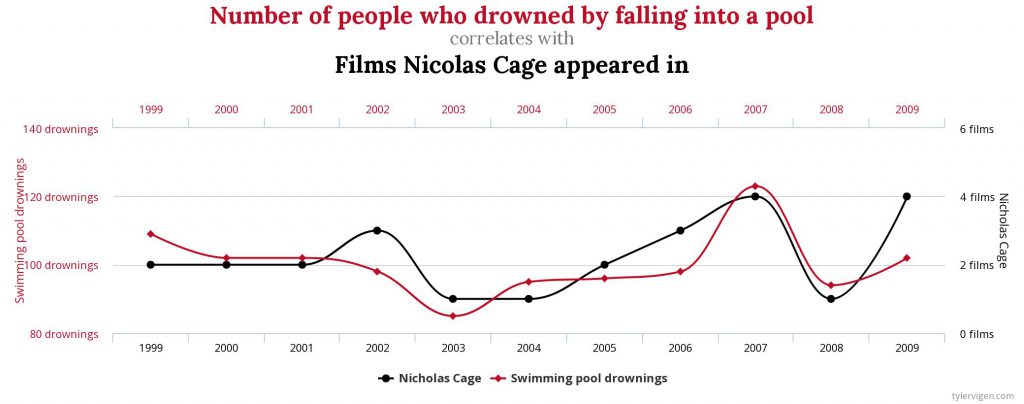
A website dedicated to creating charts depicting ridiculous correlations (like the one in the picture–clearly we must stop putting Nicolas Cage in films!). You can also pick two variables of your own from a list including topics like: interesting causes of death, sunlight by state, marriage and divorce rates. A great way for students to …
Instructors should assign this problem (about how many hours per week they played video games and their GPA) to students as in-class practice or homework after students have learned how to calculate a Pearson r correlation and test for significance. The activity leads students through determining the hypotheses, calculating the correlation coefficient, making a decision …
Practice: Calculating the Pearson r Correlation (Video Games and GPA) Read More »
Instructors should assign this problem (about scores on a math and a spelling test) to students as in-class practice or homework after students have learned how to calculate a Pearson r correlation and test for significance. The activity leads students through determining the hypotheses, calculating the correlation coefficient, making a decision about the null hypotheses …
Practice: Calculating the Pearson r Correlation (Math and Spelling Ability) Read More »
Instructors should assign this problem (about how height and running speed in the 40 yard dash) to students as in-class practice or homework after students have learned how to calculate a Pearson r correlation and test for significance. The activity leads students through determining the hypotheses, calculating the correlation coefficient, making a decision about the …
Practice: Calculating the Pearson r Correlation (Height and Running Speed) Read More »
The goal of this PowerPoint is to work through the step-by-step process of hand calculating a Person Correlation. The slides start with the formula involved and then a sample problem is presented. It is designed for you to have the class solve the problem along with you as you advance through the slides and animation. …
Lecture Slides: Calculating the Pearson r Correlation (Study Hours and GPA) Read More »
Key Topics and Links to Files Data Analysis Guide Is Going Greek a Good Idea? Analyses Included: Pearson r correlation; Descriptive Statistics (Frequencies; Central Tendency); Scale Reliability (Cronbach’s alpha); Creating a Sum Dataset Syntax Output BONUS: What Contributes to College Satisfaction? Analyses Included: Pearson r correlation; Multiple Regression Dataset Syntax Output The Data Analysis Guide …
Design & Data: Is Going Greek a Good Idea? (Survey Research and Correlation) Read More »
Activities focus on the following topics: (RELIABILITY ANALYSIS) Do People Feel Immoral After Behaving Inauthentically? Here students get to compute new variable, calculate descriptive statistics, find Cronbach’s alpha, and create a table. (CHI-SQUARE TEST OF INDEPENDENCE) Why do People Fail to Follow Through on Their Good Intentions? Here students get to conduct a t-test for …
Activities focus on the following topics: Why are People Biased When Reasoning About the Status Quo? Here students get to conduct bivariate correlations, regression, and multiple regression. They may also create a table. Do Experts Overrate the Extent of Their Expertise? Here students will conduct descriptive statistics, t-tests, multiple regression, and use a split file. …