Labs

Jamovi Assignments that Teach Climate Change

Kimberly A. Barchard (LinkedIn), Matthew R. Helm, John D. Watt , Kaelyn Griffin, from the University of Nevada, Las Vegas have created a series of Jamovi assignments. These 10 assignments include step-by-step instructions to take students from the basics of opening data files to the complexities of creating a professional conference poster (complete with literature review, method, results, graph, and […]

Jamovi Assignments that Teach Climate Change Read More »

Activity: Multi-Group Multi-Tasking

In this activity from The Learning Scientists’ blog, students are randomly assigned to one of three groups: recite the alphabet, count to 26, or go both by going back and forth (A-1-B-2, etc.). The dependent variable is how long it takes to complete the task. This could be done in class, but could also be

Activity: Multi-Group Multi-Tasking Read More »

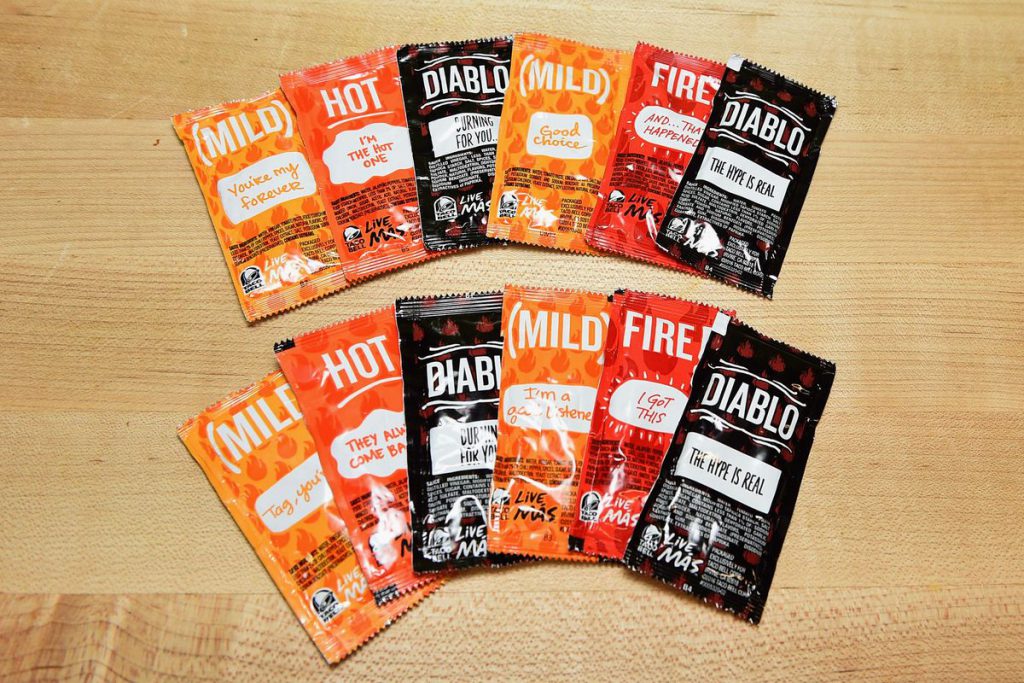
Activity: A Chi-Square Analysis of Taco Bell Sauce Packets

We all can (or should) agree that Taco Bell is the best fast food. When you take a trip to Taco Bell, they’ll inevitably ask if you would like any sauce. The best response: “surprise me.” The payoff? A heaping handful of sauce packets. But, are the flavors randomly distributed, or do they give you

Activity: A Chi-Square Analysis of Taco Bell Sauce Packets Read More »

Practice: Repeated-Measures ANOVA

In this activity, students will take data from a fictitious design to practice conducting a Repeated-Measures Analysis of Variance (ANOVA). First, provide students with the research scenario and the accompanying questions to have them determine the research design, statistical analysis to use, and independent and dependent variables. Next, have students set up a data file

Practice: Repeated-Measures ANOVA Read More »

Practice: Two-Way (Factorial) ANOVA

In this activity, students will take data from a fictitious 2 x 2 factorial design to practice conducting a Two-Way (Factorial) Analysis of Variance (ANOVA). First, provide students with the research scenario and the accompanying questions to have them determine the research design, statistical analysis to use, and independent and dependent variables. Next, have students

Practice: Two-Way (Factorial) ANOVA Read More »

Practice: One-Way ANOVA

In this activity, students will take data from a fictitious multi-group design to practice conducting a One-way Analysis of Variance (ANOVA). First, provide students with the research scenario and the accompanying questions to have them determine the research design, statistical analysis to use, and independent and dependent variables. Next, have students set up a data

Practice: One-Way ANOVA Read More »

Practice: t-test for Independent Means

In this activity, students will take data from a fictitious two-group design to practice conducting a t-test for Independent Means. First, provide students with the research scenario and the accompanying questions to have them determine the research design, statistical analysis to use, and independent and dependent variables. Next, have students set up a data file

Practice: t-test for Independent Means Read More »

Assignment: Data Visualization (Histograms, Pie Charts, and Scatterplots) (SPSS)

In this assignment (created by Dr. Kimberly A. Barchard and Dr. Leiszle Lapping-Carr), students learn how to create and edit histograms, pie charts, and scatterplots in SPSS. A detailed grading rubric is included. This assignment was designed to be completed with an existing dataset (the address is given on the assignment). The handout includes instructions

Assignment: Data Visualization (Histograms, Pie Charts, and Scatterplots) (SPSS) Read More »

Assignment: Basic Data Transformation (Recode, Reverse Code, Calculating Totals) (SPSS)

In this assignment (created by Dr. Kimberly A. Barchard and Dr. Leiszle Lapping-Carr), students learn how to recode a string variable into a numeric variable, reverse code a numeric variable, and calculate a total score. A detailed grading rubric is included. This assignment was designed to be completed with an existing dataset (the address is

Assignment: Basic Data Transformation (Recode, Reverse Code, Calculating Totals) (SPSS) Read More »

Assignment: Selecting Cases / Calculating Statistics for Subgroups (SPSS)

In this assignment (created by Dr. Kimberly A. Barchard and Dr. Leiszle Lapping-Carr), students will use SPSS to compare two subgroups (men and women) using three different methods: select cases, split file, and explore. A detailed grading rubric is included. This assignment was designed to be completed with an existing dataset (the address is given

Assignment: Selecting Cases / Calculating Statistics for Subgroups (SPSS) Read More »

Assignment: Working with Syntax (SPSS)

In this assignment (created by Dr. Kimberly A. Barchard and Dr. Leiszle Lapping-Carr), students learn create syntax commands by typing them and by using the paste function, and they will learn how to save the syntax file in SPSS format and pdf format. A detailed grading rubric is included. This assignment was designed to be

Assignment: Working with Syntax (SPSS) Read More »

Assignment: Creating a Data Set, Calculating Descriptive Statistics (SPSS)

In this assignment (created by Dr. Kimberly A. Barchard and Dr. Leiszle Lapping-Carr), students learn the basics of SPSS, including how to create a new data file or open an existing data file, enter data, calculate descriptive statistics, and save data and output files. A detailed grading rubric is included. This assignment was designed to

Assignment: Creating a Data Set, Calculating Descriptive Statistics (SPSS) Read More »

Assignment: Correlation (SPSS)

In this assignment (created by Dr. Kimberly A. Barchard and Dr. Leiszle Lapping-Carr), students learn how to calculate the Pearson Product-Moment correlation using SPSS and how to interpret the output. A detailed grading rubric is included. This assignment was designed to be completed with an existing dataset (the address is given on the assignment). The

Assignment: Correlation (SPSS) Read More »

Assignment: t-test for Independent Means/Samples (SPSS)

In this assignment (created by Dr. Kimberly A. Barchard and Dr. Leiszle Lapping-Carr), students learn how to use SPSS to compare two independent groups using the independent samples t-test and using confidence intervals for the difference of the means. Students also write a research report with their results. A detailed grading rubric is included. This

Assignment: t-test for Independent Means/Samples (SPSS) Read More »

Assignment: t-test for Dependent/Paired Samples (SPSS)

In this assignment (created by Dr. Kimberly A. Barchard and Dr. Leiszle Lapping-Carr), students learn how to use SPSS to compare dependent groups using the dependent samples t-test and using confidence intervals for the difference of the means. A detailed grading rubric is included. This assignment was designed to be completed with an existing dataset

Assignment: t-test for Dependent/Paired Samples (SPSS) Read More »

Assignment: Single Sample t-test (SPSS)

In this assignment (created by Dr. Kimberly A. Barchard and Dr. Leiszle Lapping-Carr), students learn how to use SPSS to conduct a single sample t-test and calculate a confidence interval and how to interpret the output for both. A detailed grading rubric is included. This assignment was designed to be completed with an existing dataset

Assignment: Single Sample t-test (SPSS) Read More »

Lab Activity: How Does Novelty Impact Food Enjoyment? (t-test for Independent Means/Samples)

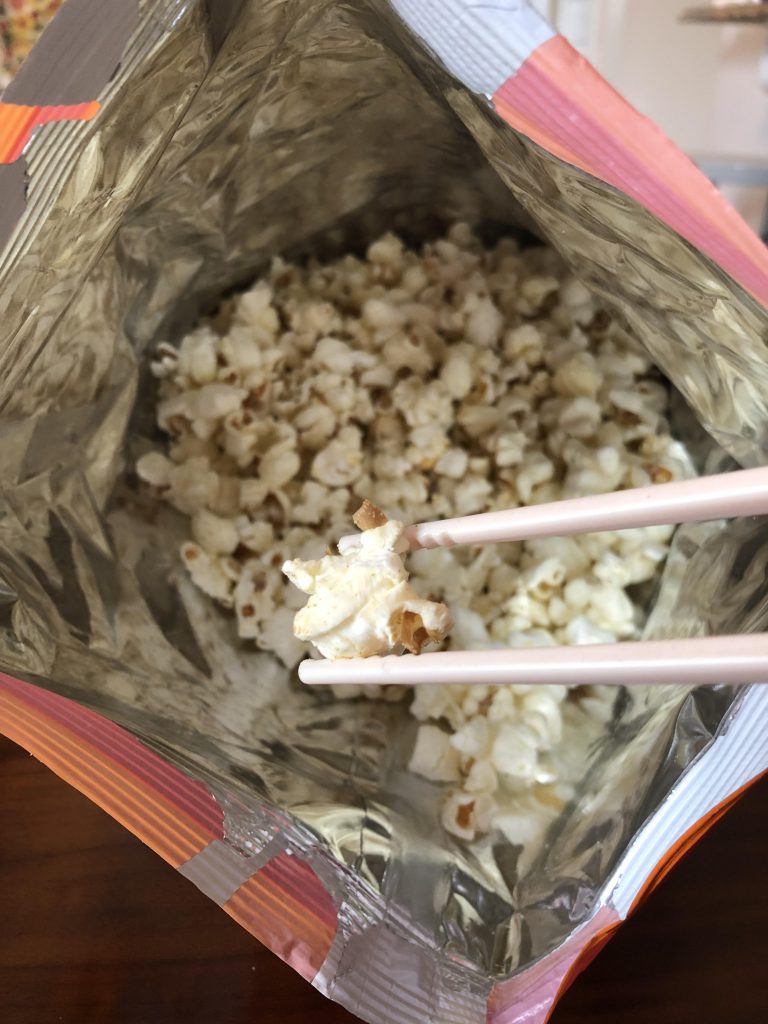
In this activity (created by Dr. Eliane Boucher), students will participate in a simplified version of the first study conducted by O’Brien and Smith (2019). In this study, participants were instructed to eat a familiar food (popcorn) in a conventional or an unconventional way (with chopsticks). Participants then rated how enjoyable the food was (note

Lab Activity: How Does Novelty Impact Food Enjoyment? (t-test for Independent Means/Samples) Read More »

Lab Activity: Caramel Apples and the single sample t-test (SPSS)

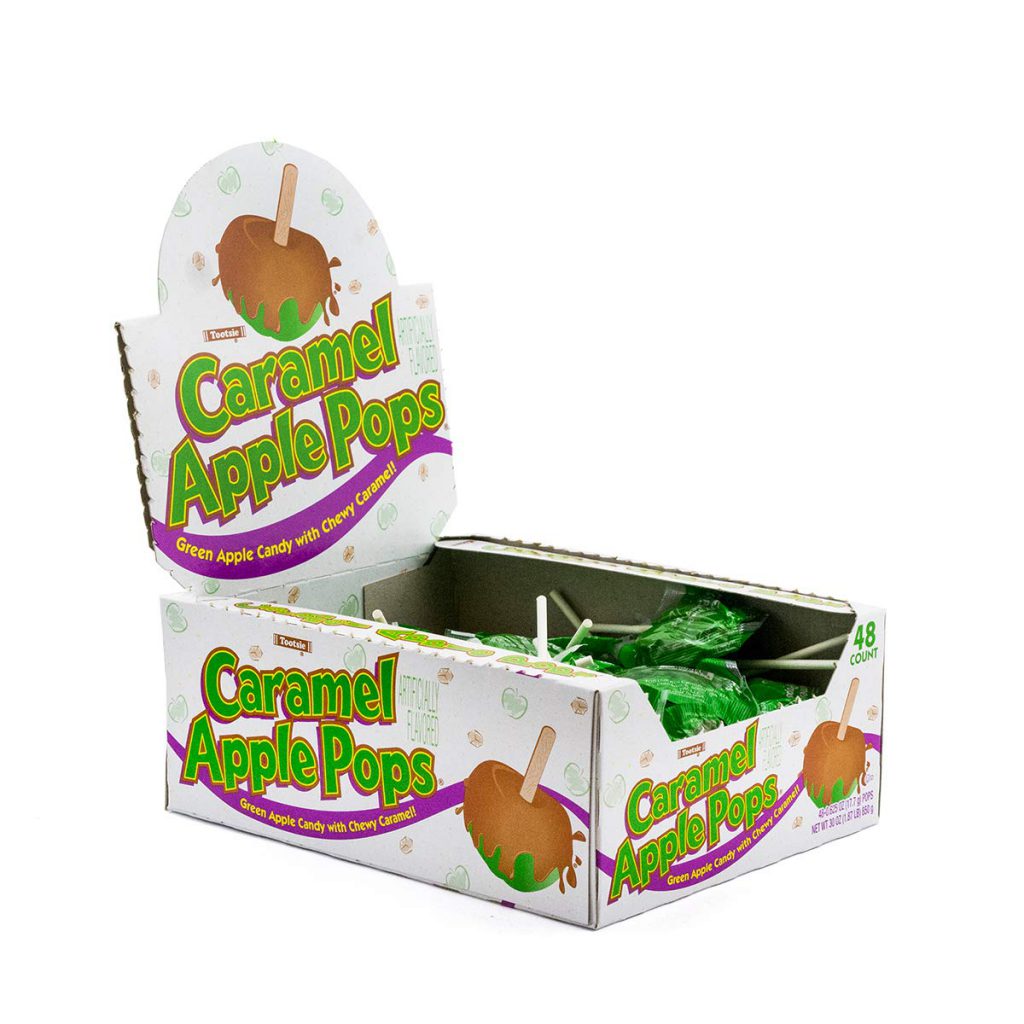
This is an activity (created by Dr. Maya G. Sen) that has has students collect data that they analyze (by hand and with SPSS) using a single-sample t-test. They compare the weights of a sample of Caramel Apple Pops to the population mean (i.e., the advertised weight). Materials NeededEnough Caramel Apple Pops for everyone (including

Lab Activity: Caramel Apples and the single sample t-test (SPSS) Read More »

Design & Data: How Do You Know If You Are Truly Helping? (Program Evaluation)

Key Topics and Links to Files Data Analysis Guide Applying Your Skills in the Real World: How Do You Know If You Are Truly Helping? Analyses Included: Single Sample t-test; t-test for Independent Means; Creating a Mean; Descriptive Statistics (Central Tendency)   Dataset Syntax Output BONUS – STUDY 1: How Can We Reduce Underage Drinking?

Design & Data: How Do You Know If You Are Truly Helping? (Program Evaluation) Read More »

Design & Data: Which Therapy is Best for Treating Eating Disorders? (Mixed Design and Mixed/Repeated-Measures ANOVA)

Key Topics and Links to Files Data Analysis Guide Which Therapy is Best for Treating Eating Disorders? Analyses Included: Mixed ANOVA/Repeated-Measures ANOVA Dataset Syntax Output BONUS: Do Others Help or Hinder Performance? Analyses Included: Mixed ANOVA/Repeated-Measures ANOVA Dataset Syntax Output The Data Analysis Guide contains all of the following: Design Summary (for the chapter study

Design & Data: Which Therapy is Best for Treating Eating Disorders? (Mixed Design and Mixed/Repeated-Measures ANOVA) Read More »