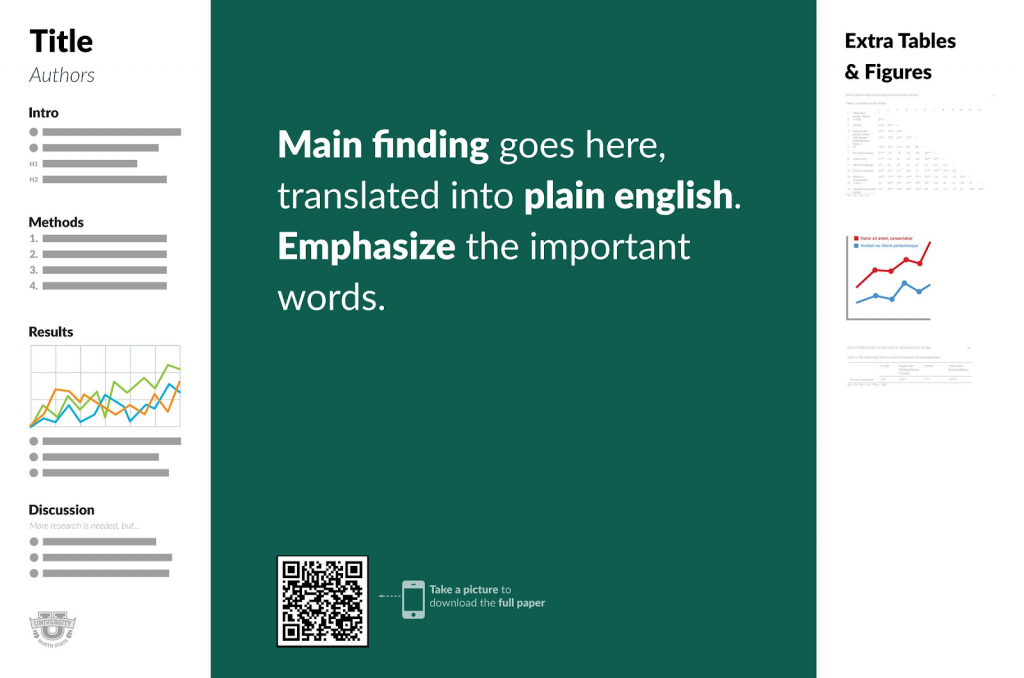
Three Things You Can do to Make Your Data Tables More Visual
Tables that contain a lot of data can be difficult to understand. This article from PolicyViz.com shows a few ways to make that information more manageable by simplifying information, highlighting key pieces, and using the right type of chart. You can find the full article here.
Three Things You Can do to Make Your Data Tables More Visual Read More »