Datasets

Activity: A Chi-Square Analysis of Taco Bell Sauce Packets

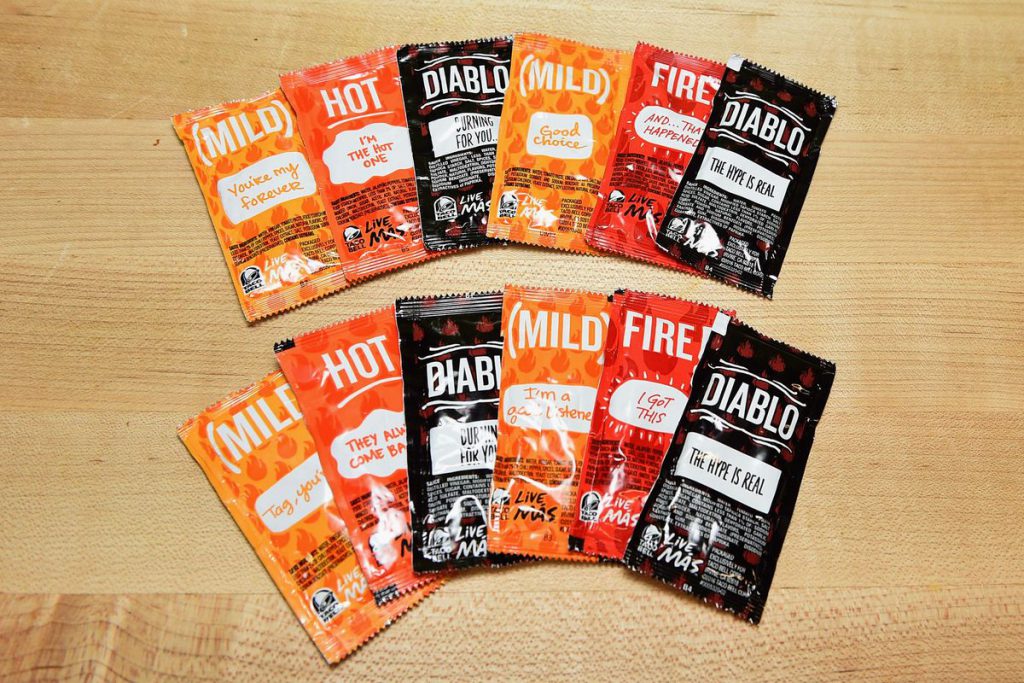
We all can (or should) agree that Taco Bell is the best fast food. When you take a trip to Taco Bell, they’ll inevitably ask if you would like any sauce. The best response: “surprise me.” The payoff? A heaping handful of sauce packets. But, are the flavors randomly distributed, or do they give you […]

Activity: A Chi-Square Analysis of Taco Bell Sauce Packets Read More »

Who Needs Data? Publicly Available Datasets You Can Use in Class

Looking for large publicly available data for your students to explore? Below we provide a collection of sources and links. Title Description Link The Stanford Open Policing Project Standardized stop data are available to download (by location) from the table below. We provide these data in both CSV and RDS formats. Click here The General Social Survey (GSS) ​​​Since

Who Needs Data? Publicly Available Datasets You Can Use in Class Read More »

Assignment: Single Sample t-test (SPSS)

In this assignment (created by Dr. Kimberly A. Barchard and Dr. Leiszle Lapping-Carr), students learn how to use SPSS to conduct a single sample t-test and calculate a confidence interval and how to interpret the output for both. A detailed grading rubric is included. This assignment was designed to be completed with an existing dataset

Assignment: Single Sample t-test (SPSS) Read More »

Design & Data: Which Therapy is Best for Treating Eating Disorders? (Mixed Design and Mixed/Repeated-Measures ANOVA)

Key Topics and Links to Files Data Analysis Guide Which Therapy is Best for Treating Eating Disorders? Analyses Included: Mixed ANOVA/Repeated-Measures ANOVA Dataset Syntax Output BONUS: Do Others Help or Hinder Performance? Analyses Included: Mixed ANOVA/Repeated-Measures ANOVA Dataset Syntax Output The Data Analysis Guide contains all of the following: Design Summary (for the chapter study

Design & Data: Which Therapy is Best for Treating Eating Disorders? (Mixed Design and Mixed/Repeated-Measures ANOVA) Read More »

Design & Data: Do Pick-up Lines Really Work? (Factorial Design and Two-Way ANOVA)

Key Topics and Links to Files Data Analysis Guide “I Lost My Phone Number, Can I Borrow Yours?” Do Pick-up Lines Really Work? Analyses Included: Two-Way ANOVA Dataset Syntax Output BONUS: Do Tattoos and How You Dress Influence Whether Someone Will Help You?   Analyses Included: Two-Way ANOVA; Descriptive Statistics (Frequencies) Dataset Syntax Output The

Design & Data: Do Pick-up Lines Really Work? (Factorial Design and Two-Way ANOVA) Read More »

Design & Data: Can Watching Reality TV Shows Be Good for Us? (Within-Subjects Design, t-test for Paired/Dependent Samples, and Repeated-Measures ANOVA)

Key Topics and Links to Files Data Analysis Guide Can Watching Reality TV Shows Be Good for Us? Analyses Included: t-test for Dependent Means/Paired Samples t-test; Repeated-Measures ANOVA Dataset Syntax Output BONUS: Does Talking Lead to Distracted Driving? Analyses Included: Repeated-Measures ANOVA Dataset Syntax Output The Data Analysis Guide contains all of the following: Design

Design & Data: Can Watching Reality TV Shows Be Good for Us? (Within-Subjects Design, t-test for Paired/Dependent Samples, and Repeated-Measures ANOVA) Read More »

Design & Data: I’m Feeling Hot, But Is the Earth Hot, Too? (MultiGroup Design and One-Way ANOVA)

Key Topics and Links to Files Data Analysis Guide I’m Feeling Hot, But Is the Earth Hot, Too? Analyses Included: One-Way Analysis of Variance (ANOVA) with Post Hoc test and Planned Contrasts; Reliability (Cronbach’s alpha); Chi-Square (Test of Independence) Dataset Syntax Output BONUS: Can Motivational Lyrics Reduce Pre-performance Anxiety and Improve Actual Task Performance? Analyses

Design & Data: I’m Feeling Hot, But Is the Earth Hot, Too? (MultiGroup Design and One-Way ANOVA) Read More »

Design & Data: Texting, I Can’t Get You Out of My Mind (Two-Group Design and t-test for Independent Means/Samples)

Key Topics and Links to Files Data Analysis Guide Texting: I Can’t Get You Out of My Mind Analyses Included: t-test for Independent Means Dataset Syntax Output BONUS: How Does the Experience of Stress Influence Feelings toward One’s Relationship? Analyses Included: t-test for Independent Means; Creating a Mean; Reliability (Cronbach’s alpha)  Dataset Syntax Output The

Design & Data: Texting, I Can’t Get You Out of My Mind (Two-Group Design and t-test for Independent Means/Samples) Read More »

Design & Data: Is Going Greek a Good Idea? (Survey Research and Correlation)

Key Topics and Links to Files Data Analysis Guide Is Going Greek a Good Idea? Analyses Included: Pearson r correlation; Descriptive Statistics (Frequencies; Central Tendency); Scale Reliability (Cronbach’s alpha); Creating a Sum Dataset Syntax Output BONUS: What Contributes to College Satisfaction? Analyses Included: Pearson r correlation; Multiple Regression Dataset Syntax Output The Data Analysis Guide

Design & Data: Is Going Greek a Good Idea? (Survey Research and Correlation) Read More »

Design & Data: How Do Parents Respond to Their Child’s Public Tantrums? (Observational Research/Descriptive Statistics)

Key Topics and Links to Files Data Analysis Guide The Many Forms of Discipline in Parents’ Bag of Tricks Analyses Included: Descriptive Statistics (Frequencies; Central Tendency); Inter-observer Reliability (Cohen’s Kappa); Inter-observer Reliability (Pearson’s r); Creating a Mean; Creating a Median Split; Selecting Cases Dataset Syntax Output BONUS: Dyads at Diners (How often and how much

Design & Data: How Do Parents Respond to Their Child’s Public Tantrums? (Observational Research/Descriptive Statistics) Read More »

Lecture Slides: How Personality Differs across the United States (ANOVA Review)

These slides (created by Dr. Jessica Hartnett) discuss a one-way ANOVA example from published research examining if different parts of the United States exhibit different personalities. In her blog post about it, she includes a link to a Time magazine article about the study, CSV and Excel versions of the dataset. Here is a blog

Lecture Slides: How Personality Differs across the United States (ANOVA Review) Read More »

Open Stats Lab: Additional Activities

Activities focus on the following topics: (RELIABILITY ANALYSIS) Do People Feel Immoral After Behaving Inauthentically? Here students get to compute new variable, calculate descriptive statistics, find Cronbach’s alpha, and create a table. (CHI-SQUARE TEST OF INDEPENDENCE) Why do People Fail to Follow Through on Their Good Intentions? Here students get to conduct a t-test for

Open Stats Lab: Additional Activities Read More »

Open Stats Lab: Two-Way (Factorial) ANOVA Activities

Activities focus on the following topics: (TWO-WAY ANOVA) Do People Judge Physical Distances of Locations Based on Their Psychological Orientation Toward Them? Here students get to conduct a two-way (factorial) ANOVA, tests for the interaction, and create a figure. (MIXED ANOVA) Do People Underestimate the Pleasure of Remembering Ordinary vs. Extraordinary Events? Here students get

Open Stats Lab: Two-Way (Factorial) ANOVA Activities Read More »

Open Stats Lab: t-test Activities

Activities focus on the following topics: (SINGLE SAMPLE and PAIRED-SAMPLES) Does Music Convey Social Information to Infants? Here students get to conduct a single/one sample t-test, a t-test for dependent means (paired samples), and can create a boxplot and/or scatterplot. (TWO INDEPENDENT SAMPLES) Do Spoken or Written Words Better Express Intelligence? Here students get to

Open Stats Lab: t-test Activities Read More »

Open Stats Lab: Regression Activities

Activities focus on the following topics: Why are People Biased When Reasoning About the Status Quo? Here students get to conduct bivariate correlations, regression, and multiple regression. They may also create a table. Do Experts Overrate the Extent of Their Expertise? Here students will conduct descriptive statistics, t-tests, multiple regression, and use a split file.

Open Stats Lab: Regression Activities Read More »

Open Stats Lab: Correlation Activities

Activities focus on the following topics: Does Being Wealthy Distort Perceptions of Wealth Inequality? Here students get to create new variables, calculate means and standard deviations, and conduct bivariate correlations. Do Outbreaks of Infectious Diseases Influence Voting Behavior? Here students will need to select certain cases for the analysis, conduct bivariate correlations, and generate scatterplots.

Open Stats Lab: Correlation Activities Read More »

Link: Open Stats Lab

Open Stats Lab (OSL) is a free resource for the teaching of introductory statistics. From the site: “OSL is primarily a resource for the teaching (and learning) of statistics. Although many statistics textbooks come with supplemental data sets to help train students in data analysis, these data sets often lack the richness and complexity of

Link: Open Stats Lab Read More »