
From the website:
“Enter a typical paper and we’ll build you a graph of similar papers in the field. Explore and build more graphs for interesting papers that you find – soon you’ll have a real, visual understanding of the trends, popular works and dynamics of the field you’re interested in. “
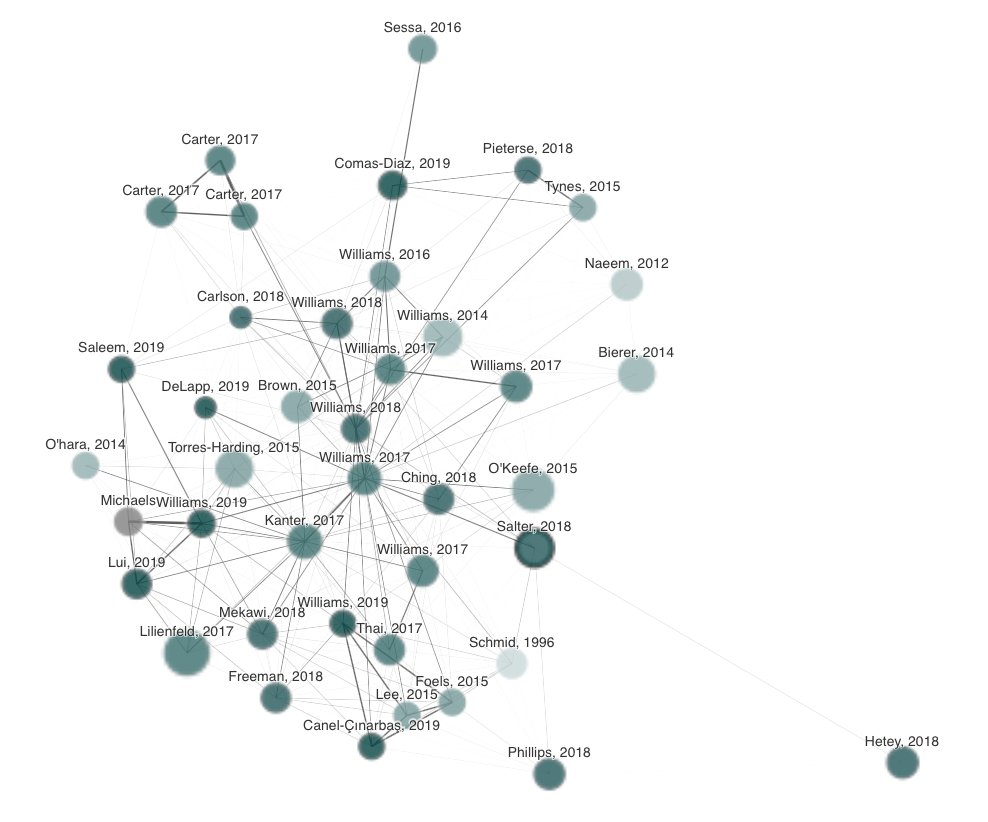
In the above example, the original paper was “Racism in the Structure of Everyday Worlds: A Cultural-Psychological Perspective” by Salter et al.
As the cite explains, within the graph, “Each node is an academic paper related to the origin paper.” The bigger the node, the larger the number of citations, with node orientation based on how similar it is to the original paper.
Students often struggle finding related sources, as well as seeing and articulating the connections. Displaying it visually should be helpful. It’s also a nice example of data visualization.
Please click here for the file.