Statistics

Video: Statistical Significance What Are p Values? How Do We Interpret Them? How Do We Calculate Them?

A video (11:21) (which includes an “awesome song” in the beginning) that explains p values and their interpretation from StatQuest with Josh Starmer. Bam. Students should watch this before the video (below) on calculating p values. If you’re interested in how to calculate p values, this video (25:14) gives a thorough explanation. You can find

Video: Statistical Significance What Are p Values? How Do We Interpret Them? How Do We Calculate Them? Read More »

Video: What is a Distribution? Normal Distributions, Clearly Explained

A short (5:14) video that introduces statistical distributions from StatQuest with Josh Starmer. This is great for students to watch before a discussion of the normal distribution. A short (5:12) video that clearly explains normal distributions from StatQuest with Josh Starmer. You can find the StatQuest website here.

Video: What is a Distribution? Normal Distributions, Clearly Explained Read More »

Assignment: Data Visualization (Histograms, Pie Charts, and Scatterplots) (SPSS)

In this assignment (created by Dr. Kimberly A. Barchard and Dr. Leiszle Lapping-Carr), students learn how to create and edit histograms, pie charts, and scatterplots in SPSS. A detailed grading rubric is included. This assignment was designed to be completed with an existing dataset (the address is given on the assignment). The handout includes instructions

Assignment: Data Visualization (Histograms, Pie Charts, and Scatterplots) (SPSS) Read More »

Assignment: Basic Data Transformation (Recode, Reverse Code, Calculating Totals) (SPSS)

In this assignment (created by Dr. Kimberly A. Barchard and Dr. Leiszle Lapping-Carr), students learn how to recode a string variable into a numeric variable, reverse code a numeric variable, and calculate a total score. A detailed grading rubric is included. This assignment was designed to be completed with an existing dataset (the address is

Assignment: Basic Data Transformation (Recode, Reverse Code, Calculating Totals) (SPSS) Read More »

Assignment: Selecting Cases / Calculating Statistics for Subgroups (SPSS)

In this assignment (created by Dr. Kimberly A. Barchard and Dr. Leiszle Lapping-Carr), students will use SPSS to compare two subgroups (men and women) using three different methods: select cases, split file, and explore. A detailed grading rubric is included. This assignment was designed to be completed with an existing dataset (the address is given

Assignment: Selecting Cases / Calculating Statistics for Subgroups (SPSS) Read More »

Assignment: Working with Syntax (SPSS)

In this assignment (created by Dr. Kimberly A. Barchard and Dr. Leiszle Lapping-Carr), students learn create syntax commands by typing them and by using the paste function, and they will learn how to save the syntax file in SPSS format and pdf format. A detailed grading rubric is included. This assignment was designed to be

Assignment: Working with Syntax (SPSS) Read More »

Assignment: Creating a Data Set, Calculating Descriptive Statistics (SPSS)

In this assignment (created by Dr. Kimberly A. Barchard and Dr. Leiszle Lapping-Carr), students learn the basics of SPSS, including how to create a new data file or open an existing data file, enter data, calculate descriptive statistics, and save data and output files. A detailed grading rubric is included. This assignment was designed to

Assignment: Creating a Data Set, Calculating Descriptive Statistics (SPSS) Read More »

Assignment: Correlation (SPSS)

In this assignment (created by Dr. Kimberly A. Barchard and Dr. Leiszle Lapping-Carr), students learn how to calculate the Pearson Product-Moment correlation using SPSS and how to interpret the output. A detailed grading rubric is included. This assignment was designed to be completed with an existing dataset (the address is given on the assignment). The

Assignment: Correlation (SPSS) Read More »

Assignment: t-test for Independent Means/Samples (SPSS)

In this assignment (created by Dr. Kimberly A. Barchard and Dr. Leiszle Lapping-Carr), students learn how to use SPSS to compare two independent groups using the independent samples t-test and using confidence intervals for the difference of the means. Students also write a research report with their results. A detailed grading rubric is included. This

Assignment: t-test for Independent Means/Samples (SPSS) Read More »

Assignment: t-test for Dependent/Paired Samples (SPSS)

In this assignment (created by Dr. Kimberly A. Barchard and Dr. Leiszle Lapping-Carr), students learn how to use SPSS to compare dependent groups using the dependent samples t-test and using confidence intervals for the difference of the means. A detailed grading rubric is included. This assignment was designed to be completed with an existing dataset

Assignment: t-test for Dependent/Paired Samples (SPSS) Read More »

Assignment: Single Sample t-test (SPSS)

In this assignment (created by Dr. Kimberly A. Barchard and Dr. Leiszle Lapping-Carr), students learn how to use SPSS to conduct a single sample t-test and calculate a confidence interval and how to interpret the output for both. A detailed grading rubric is included. This assignment was designed to be completed with an existing dataset

Assignment: Single Sample t-test (SPSS) Read More »

Tutorial: Choosing the Correct Test (WISE)

Online tutorial gives students descriptions of research and asks them to select the correct statistic to analyze the data. There are 11 examples in total. Students respond via multiple choice questions and the tutorial provides guidance/feedback throughout. You can access the tutorial here.

Tutorial: Choosing the Correct Test (WISE) Read More »

Tutorial: Regression (WISE)

Online tutorial that guides students through a research study and data analysis using regression. There are 4 modules total, with the first three being most appropriate for an introductory course. Module 3 is short and could be used as an in-class demonstration. Module 4 is more advanced. During the tutorial students will start with a

Tutorial: Regression (WISE) Read More »

Tutorial: t-test for Independent Means/Samples (WISE)

Online tutorial that guides students through a research study and data analysis using a t-test for independent means/samples. This particular study compares differences in child rearing practices in Belize and Samoa. During the tutorial students will need to review data for data entry errors, look at descriptive statistics, form a hypothesis, perform the statistic, and

Tutorial: t-test for Independent Means/Samples (WISE) Read More »

Video: Statistical Power, Clearly Explained

A short (8:19) video (which includes an “awesome song” in the beginning) that explains statistical power from StatQuest with Josh Starmer. Bam. If you’re interested in the follow-up video on power analysis, you can find that here. You can find the StatQuest website here.

Video: Statistical Power, Clearly Explained Read More »

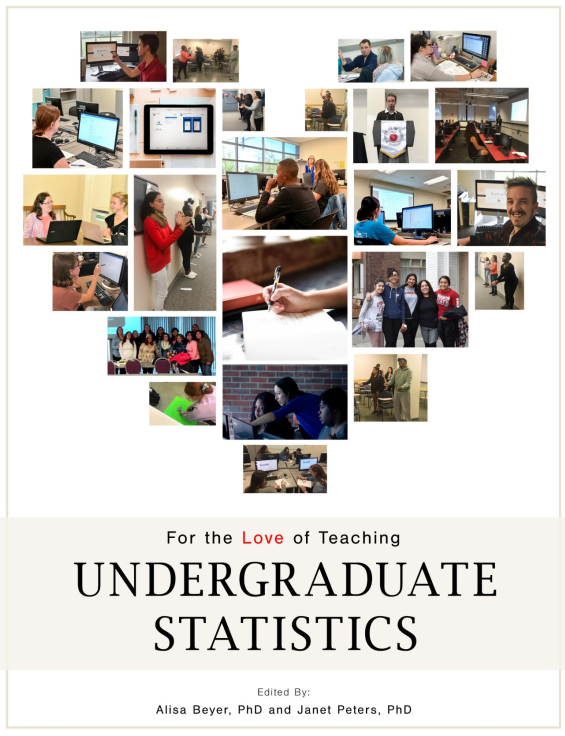
Resource: For the Love of Teaching Undergraduate Statistics

From the website: “Statistics education,  a crucial component of the undergraduate psychology curriculum, is one of the most challenging topics for students to learn and for faculty to teach.  For the Love of Teaching Undergraduate Statistics is designed to provide readers with advice, best practices, and fun ideas for teaching an introductory statistics course to undergraduate psychology students.

Resource: For the Love of Teaching Undergraduate Statistics Read More »

The Price is Right for Confidence Intervals

Dr. Alexis Grosofsky uses a game from The Price is Right to illustrate confidence intervals (CIs). The game can demonstrate the idea behind how a CI works. Students often find conceptual materials more difficult than computational – a concrete example helps make the concept of a confidence interval more understandable (and memorable). The video clips

The Price is Right for Confidence Intervals Read More »