Discovering the Scientist Within

Who Needs Data? Publicly Available Datasets You Can Use in Class

Looking for large publicly available data for your students to explore? Below we provide a collection of sources and links. Title Description Link The Stanford Open Policing Project Standardized stop data are available to download (by location) from the table below. We provide these data in both CSV and RDS formats. Click here The General Social Survey (GSS) ​​​Since […]

Who Needs Data? Publicly Available Datasets You Can Use in Class Read More »

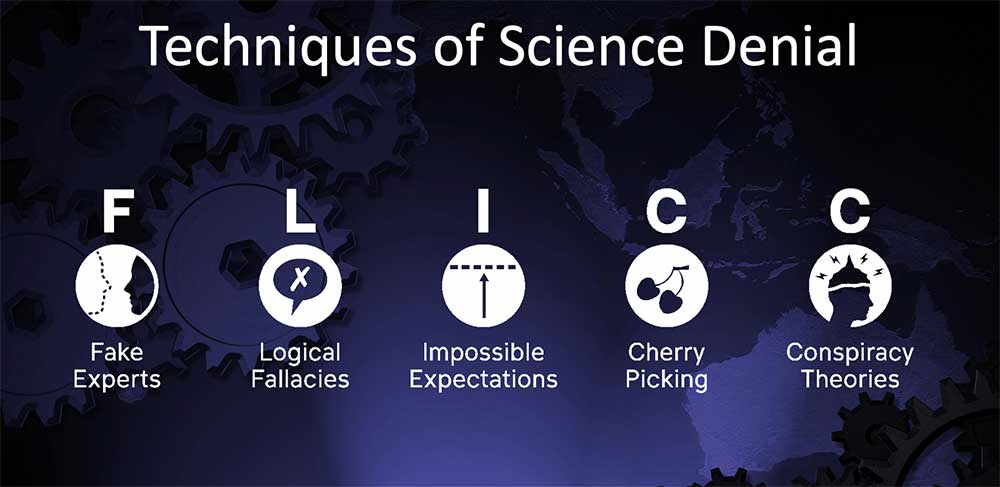
The 5 Techniques of Science Denial

In the article “A history of FLICC: the 5 techniques of science denial” places five strategies (Fake experts, Logical fallacies, Impossible expectations, Cherry picking, and Conspiracy theories.) into a the acronym FLICC. This article, elaborates on many other techniques within these broad 5 categories, including examples of each. The article includes links to a three

The 5 Techniques of Science Denial Read More »

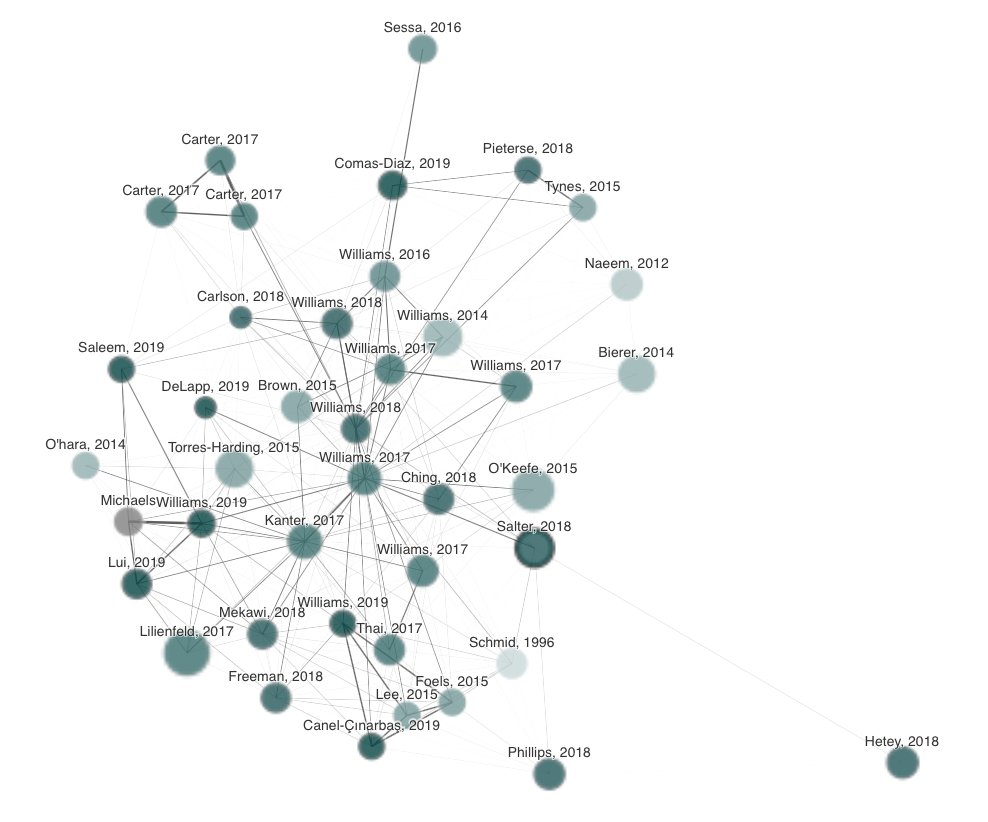
Connected Papers: A Visual Tool for Writing Literature Reviews

From the website: “Enter a typical paper and we’ll build you a graph of similar papers in the field. Explore and build more graphs for interesting papers that you find – soon you’ll have a real, visual understanding of the trends, popular works and dynamics of the field you’re interested in. “ In the above example,

Connected Papers: A Visual Tool for Writing Literature Reviews Read More »

Practice: Repeated-Measures ANOVA

In this activity, students will take data from a fictitious design to practice conducting a Repeated-Measures Analysis of Variance (ANOVA). First, provide students with the research scenario and the accompanying questions to have them determine the research design, statistical analysis to use, and independent and dependent variables. Next, have students set up a data file

Practice: Repeated-Measures ANOVA Read More »

Practice: Two-Way (Factorial) ANOVA

In this activity, students will take data from a fictitious 2 x 2 factorial design to practice conducting a Two-Way (Factorial) Analysis of Variance (ANOVA). First, provide students with the research scenario and the accompanying questions to have them determine the research design, statistical analysis to use, and independent and dependent variables. Next, have students

Practice: Two-Way (Factorial) ANOVA Read More »

Practice: One-Way ANOVA

In this activity, students will take data from a fictitious multi-group design to practice conducting a One-way Analysis of Variance (ANOVA). First, provide students with the research scenario and the accompanying questions to have them determine the research design, statistical analysis to use, and independent and dependent variables. Next, have students set up a data

Practice: One-Way ANOVA Read More »

Practice: t-test for Independent Means

In this activity, students will take data from a fictitious two-group design to practice conducting a t-test for Independent Means. First, provide students with the research scenario and the accompanying questions to have them determine the research design, statistical analysis to use, and independent and dependent variables. Next, have students set up a data file

Practice: t-test for Independent Means Read More »

Video: Sample from a Statistical Distribution, Clearly Explained

This short video (3:48) explains sampling a distribution from StatQuest with Josh Starmer. Bam. Before watching, students should be familiar with histograms. You can find the StatQuest website here.

Video: Sample from a Statistical Distribution, Clearly Explained Read More »

Video: Central Limit Theorem and Distributions of Sample Means

This video (7:34) explains the central limit theorem, where distributions of means of samples come from, and how those distributions are normally distributed from StatQuest with Josh Starmer. Bam. Before watching, students should have a good understanding of the normal distribution. You can find the StatQuest website here.

Video: Central Limit Theorem and Distributions of Sample Means Read More »

Video: Statistical Significance What Are p Values? How Do We Interpret Them? How Do We Calculate Them?

A video (11:21) (which includes an “awesome song” in the beginning) that explains p values and their interpretation from StatQuest with Josh Starmer. Bam. Students should watch this before the video (below) on calculating p values. If you’re interested in how to calculate p values, this video (25:14) gives a thorough explanation. You can find

Video: Statistical Significance What Are p Values? How Do We Interpret Them? How Do We Calculate Them? Read More »

Video: What is a Distribution? Normal Distributions, Clearly Explained

A short (5:14) video that introduces statistical distributions from StatQuest with Josh Starmer. This is great for students to watch before a discussion of the normal distribution. A short (5:12) video that clearly explains normal distributions from StatQuest with Josh Starmer. You can find the StatQuest website here.

Video: What is a Distribution? Normal Distributions, Clearly Explained Read More »

Assignment: Data Visualization (Histograms, Pie Charts, and Scatterplots) (SPSS)

In this assignment (created by Dr. Kimberly A. Barchard and Dr. Leiszle Lapping-Carr), students learn how to create and edit histograms, pie charts, and scatterplots in SPSS. A detailed grading rubric is included. This assignment was designed to be completed with an existing dataset (the address is given on the assignment). The handout includes instructions

Assignment: Data Visualization (Histograms, Pie Charts, and Scatterplots) (SPSS) Read More »

Assignment: Basic Data Transformation (Recode, Reverse Code, Calculating Totals) (SPSS)

In this assignment (created by Dr. Kimberly A. Barchard and Dr. Leiszle Lapping-Carr), students learn how to recode a string variable into a numeric variable, reverse code a numeric variable, and calculate a total score. A detailed grading rubric is included. This assignment was designed to be completed with an existing dataset (the address is

Assignment: Basic Data Transformation (Recode, Reverse Code, Calculating Totals) (SPSS) Read More »

Assignment: Selecting Cases / Calculating Statistics for Subgroups (SPSS)

In this assignment (created by Dr. Kimberly A. Barchard and Dr. Leiszle Lapping-Carr), students will use SPSS to compare two subgroups (men and women) using three different methods: select cases, split file, and explore. A detailed grading rubric is included. This assignment was designed to be completed with an existing dataset (the address is given

Assignment: Selecting Cases / Calculating Statistics for Subgroups (SPSS) Read More »

Assignment: Working with Syntax (SPSS)

In this assignment (created by Dr. Kimberly A. Barchard and Dr. Leiszle Lapping-Carr), students learn create syntax commands by typing them and by using the paste function, and they will learn how to save the syntax file in SPSS format and pdf format. A detailed grading rubric is included. This assignment was designed to be

Assignment: Working with Syntax (SPSS) Read More »

Assignment: Creating a Data Set, Calculating Descriptive Statistics (SPSS)

In this assignment (created by Dr. Kimberly A. Barchard and Dr. Leiszle Lapping-Carr), students learn the basics of SPSS, including how to create a new data file or open an existing data file, enter data, calculate descriptive statistics, and save data and output files. A detailed grading rubric is included. This assignment was designed to

Assignment: Creating a Data Set, Calculating Descriptive Statistics (SPSS) Read More »

Assignment: Correlation (SPSS)

In this assignment (created by Dr. Kimberly A. Barchard and Dr. Leiszle Lapping-Carr), students learn how to calculate the Pearson Product-Moment correlation using SPSS and how to interpret the output. A detailed grading rubric is included. This assignment was designed to be completed with an existing dataset (the address is given on the assignment). The

Assignment: Correlation (SPSS) Read More »