Research Methods

Exemplar Study: Must Be Love on the Brain (Within-Subjects/Repeated-Measures Design)

This research focused on the brain functioning of people in love. Participants who rated themselves as being intensely in love, viewed a photo of their beloved, did a distracter task, and then viewed a photo of a neutral acquaintance while researchers took functional magnetic resonance imagery (fMRI). Each participant repeated the procedure six times. When […]

Exemplar Study: Must Be Love on the Brain (Within-Subjects/Repeated-Measures Design) Read More »

Exemplar Study: Can Using Obscenities Make You More Persuasive? (Multigroup Design)

This multigroup experiment examined the use of an obscenity on thepersuasiveness of a pro-attitudinal message and on perceptions of thecommunicator. Participants watched one of three versions of a video inwhich the speaker advocated lowering tuition at another university. In thefirst version, the speaker used the word “damn” at the beginning of themessage. In the second

Exemplar Study: Can Using Obscenities Make You More Persuasive? (Multigroup Design) Read More »

Exemplar Study: Social Exclusion and Prosocial Behavior (Multigroup Design)

This article indicated that being excluded from social groups leads todecreases in prosocial behavior. Participants received either no feedback on apersonality measure or one of three types of false feedback that indicated afuture full of rewarding relationships, loneliness, or unfortunate accidents.Participants receiving the social exclusion feedback were unwilling tovolunteer for further lab experiments and, after

Exemplar Study: Social Exclusion and Prosocial Behavior (Multigroup Design) Read More »

Exemplar Study: Tipping in Restaurants (Two-group Design/Simple Experiment)

To evaluate the effect that a helpful message from a server might have on restaurant tips, the server either wrote a message about an upcoming dinner special on the back of the dining check or left it blank. Dining parties who received a check with the helpful message tipped a higher percentage of the final

Exemplar Study: Tipping in Restaurants (Two-group Design/Simple Experiment) Read More »

Resources: Best Books for Teaching Online

This is a collection of books that can help with moving your research methods or statistics course online. Although they may not address methods and stats specifically, instructors can easily adapt the ideas in these books to their own courses. Small Teaching Online: Applying Learning Science in Online Classes by Flower Darby & James M.

Resources: Best Books for Teaching Online Read More »

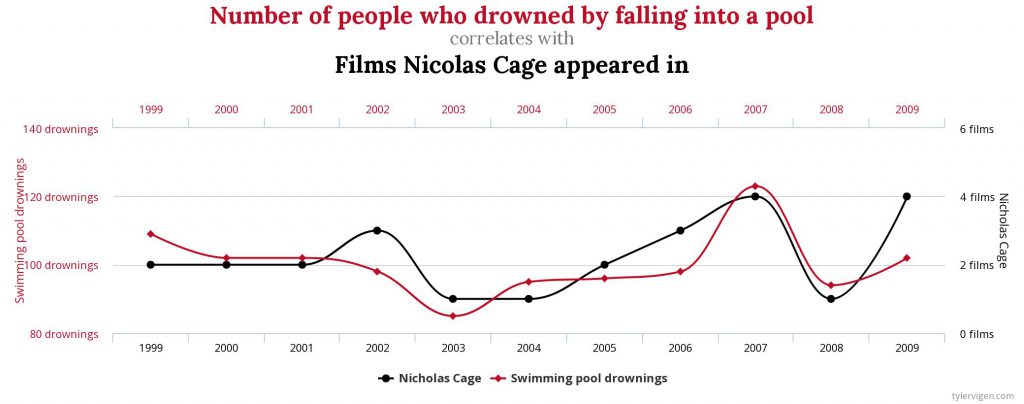
Link: Spurious Correlation Examples

A website dedicated to creating charts depicting ridiculous correlations (like the one in the picture–clearly we must stop putting Nicolas Cage in films!). You can also pick two variables of your own from a list including topics like: interesting causes of death, sunlight by state, marriage and divorce rates. A great way for students to

Link: Spurious Correlation Examples Read More »

Practice: Measuring Dependent Variables: Types and Scales of Measurement

This is a brief in-class practice activity (created by Raechel Soicher) to help students review different types of measurement for dependent variables as well as identify scales of measurement. Raechel recommends teaching about the different ways to measure a dependent variable before giving students the opportunity to review using this brief worksheet. She provides definitions

Practice: Measuring Dependent Variables: Types and Scales of Measurement Read More »

Practice: Having Fun with Operational Definitions

One of the challenges instructors face when discussing conceptual and operational definitions of variables is helping students to understand that the operational definition of a variable involves measuring the variable in a concrete, quantitative manner. The practice activity asks students to identify the relevant variables of interest and then suggest ways that these variables can

Practice: Having Fun with Operational Definitions Read More »

Practice: Calculating the Pearson r Correlation (Video Games and GPA)

Instructors should assign this problem (about how many hours per week they played video games and their GPA) to students as in-class practice or homework after students have learned how to calculate a Pearson r correlation and test for significance. The activity leads students through determining the hypotheses, calculating the correlation coefficient, making a decision

Practice: Calculating the Pearson r Correlation (Video Games and GPA) Read More »

Practice: Calculating the Pearson r Correlation (Math and Spelling Ability)

Instructors should assign this problem (about scores on a math and a spelling test) to students as in-class practice or homework after students have learned how to calculate a Pearson r correlation and test for significance. The activity leads students through determining the hypotheses, calculating the correlation coefficient, making a decision about the null hypotheses

Practice: Calculating the Pearson r Correlation (Math and Spelling Ability) Read More »

Practice: Calculating the Pearson r Correlation (Height and Running Speed)

Instructors should assign this problem (about how height and running speed in the 40 yard dash) to students as in-class practice or homework after students have learned how to calculate a Pearson r correlation and test for significance. The activity leads students through determining the hypotheses, calculating the correlation coefficient, making a decision about the

Practice: Calculating the Pearson r Correlation (Height and Running Speed) Read More »

Practice: Calculating the t-test for Independent Samples/Means (Temperature and Mood)

Instructors should assign this problem (about how temperature impacts mood) to students as in-class practice or homework after students have learned how to calculate a t-test for independent means and test for significance. The activity leads students through determining the type of statistical analysis to use, the hypotheses, calculating the t-ratio and effect size (if

Practice: Calculating the t-test for Independent Samples/Means (Temperature and Mood) Read More »

Practice: Calculating the t-test for Independent Samples/Means (Research Methods and GPA)

Instructors should assign this problem (about how taking research methods impacts GPA) to students as in-class practice or homework after students have learned how to calculate a t-test for independent means and test for significance. The activity leads students through determining the type of statistical analysis to use, the hypotheses, calculating the t-ratio and effect

Practice: Calculating the t-test for Independent Samples/Means (Research Methods and GPA) Read More »

Practice: Calculating the t-test for Paired-Samples/Dependent Means (Drugs and Learning)

Instructors should assign this problem (about drugs and learning) to students as in-class practice or homework after students have learned how to calculate a t-test for dependent means and test for significance. The activity leads students through determining the type of statistical analysis to use, the hypotheses, calculating the t-ratio and effect size (if appropriate),

Practice: Calculating the t-test for Paired-Samples/Dependent Means (Drugs and Learning) Read More »

Lecture Slides: Measuring Dependent Variables

This  lecture introduces students to several different ways of measuring   behavior as the dependent variable.  Several types of behavioral measures are shown, including: behavioral trace, behavioral observation, and behavioral choice. The goal of this lecture is to get students to see other types of measuring DVs, aside from self-report. This starts with a quick overview

Lecture Slides: Measuring Dependent Variables Read More »

Lecture Slides: Manipulating Independent Variables

This  lecture introduces students to several different ways of manipulating independent variables. Some techniques covered include: mock Facebook profiles, priming, having participants count money, and viewing cute pictures. The goal of this lecture is to get students to see a variety of ways that researchers can manipulate IVs. Each example provides the citation for the

Lecture Slides: Manipulating Independent Variables Read More »

Lecture Slides: Calculating the t-test for Independent Means/Samples (Does Eating Spinach Make Your Stronger?)

The goal of this PowerPoint is to work through the step-by-step process of hand calculating a t-test for independent means. The slides start with an explanation of the formula involved and then a sample problem is presented. It is designed for you to have the class solve the problem along with you as you advance

Lecture Slides: Calculating the t-test for Independent Means/Samples (Does Eating Spinach Make Your Stronger?) Read More »

Lecture Slides: Calculating the Pearson r Correlation (Study Hours and GPA)

The goal of this PowerPoint is to work through the step-by-step process of hand calculating a Person Correlation. The slides start with the formula involved and then a sample problem is presented. It is designed for you to have the class solve the problem along with you as you advance through the slides and animation.

Lecture Slides: Calculating the Pearson r Correlation (Study Hours and GPA) Read More »

Lecture Slides: Calculating the t-test for Paired-Samples/Dependent Means (Weight Loss Study)

The goal of this PowerPoint is to work through the step-by-step process of hand calculating a t-test for dependent means. The slides start with an explanation of the formula involved and then a sample problem is presented. It is designed for you to have the class solve the problem along with you as you advance

Lecture Slides: Calculating the t-test for Paired-Samples/Dependent Means (Weight Loss Study) Read More »