June 2020

Assignment: Creating a Data Set, Calculating Descriptive Statistics (SPSS)

In this assignment (created by Dr. Kimberly A. Barchard and Dr. Leiszle Lapping-Carr), students learn the basics of SPSS, including how to create a new data file or open an existing data file, enter data, calculate descriptive statistics, and save data and output files. A detailed grading rubric is included. This assignment was designed to […]

Assignment: Creating a Data Set, Calculating Descriptive Statistics (SPSS) Read More »

Assignment: Correlation (SPSS)

In this assignment (created by Dr. Kimberly A. Barchard and Dr. Leiszle Lapping-Carr), students learn how to calculate the Pearson Product-Moment correlation using SPSS and how to interpret the output. A detailed grading rubric is included. This assignment was designed to be completed with an existing dataset (the address is given on the assignment). The

Assignment: Correlation (SPSS) Read More »

Assignment: t-test for Independent Means/Samples (SPSS)

In this assignment (created by Dr. Kimberly A. Barchard and Dr. Leiszle Lapping-Carr), students learn how to use SPSS to compare two independent groups using the independent samples t-test and using confidence intervals for the difference of the means. Students also write a research report with their results. A detailed grading rubric is included. This

Assignment: t-test for Independent Means/Samples (SPSS) Read More »

Assignment: t-test for Dependent/Paired Samples (SPSS)

In this assignment (created by Dr. Kimberly A. Barchard and Dr. Leiszle Lapping-Carr), students learn how to use SPSS to compare dependent groups using the dependent samples t-test and using confidence intervals for the difference of the means. A detailed grading rubric is included. This assignment was designed to be completed with an existing dataset

Assignment: t-test for Dependent/Paired Samples (SPSS) Read More »

Assignment: Single Sample t-test (SPSS)

In this assignment (created by Dr. Kimberly A. Barchard and Dr. Leiszle Lapping-Carr), students learn how to use SPSS to conduct a single sample t-test and calculate a confidence interval and how to interpret the output for both. A detailed grading rubric is included. This assignment was designed to be completed with an existing dataset

Assignment: Single Sample t-test (SPSS) Read More »

Tutorial: Choosing the Correct Test (WISE)

Online tutorial gives students descriptions of research and asks them to select the correct statistic to analyze the data. There are 11 examples in total. Students respond via multiple choice questions and the tutorial provides guidance/feedback throughout. You can access the tutorial here.

Tutorial: Choosing the Correct Test (WISE) Read More »

Tutorial: Regression (WISE)

Online tutorial that guides students through a research study and data analysis using regression. There are 4 modules total, with the first three being most appropriate for an introductory course. Module 3 is short and could be used as an in-class demonstration. Module 4 is more advanced. During the tutorial students will start with a

Tutorial: Regression (WISE) Read More »

Tutorial: t-test for Independent Means/Samples (WISE)

Online tutorial that guides students through a research study and data analysis using a t-test for independent means/samples. This particular study compares differences in child rearing practices in Belize and Samoa. During the tutorial students will need to review data for data entry errors, look at descriptive statistics, form a hypothesis, perform the statistic, and

Tutorial: t-test for Independent Means/Samples (WISE) Read More »

Video: Statistical Power, Clearly Explained

A short (8:19) video (which includes an “awesome song” in the beginning) that explains statistical power from StatQuest with Josh Starmer. Bam. If you’re interested in the follow-up video on power analysis, you can find that here. You can find the StatQuest website here.

Video: Statistical Power, Clearly Explained Read More »

Resource: For the Love of Teaching Undergraduate Statistics

From the website: “Statistics education,  a crucial component of the undergraduate psychology curriculum, is one of the most challenging topics for students to learn and for faculty to teach.  For the Love of Teaching Undergraduate Statistics is designed to provide readers with advice, best practices, and fun ideas for teaching an introductory statistics course to undergraduate psychology students.

Resource: For the Love of Teaching Undergraduate Statistics Read More »

The Price is Right for Confidence Intervals

Dr. Alexis Grosofsky uses a game from The Price is Right to illustrate confidence intervals (CIs). The game can demonstrate the idea behind how a CI works. Students often find conceptual materials more difficult than computational – a concrete example helps make the concept of a confidence interval more understandable (and memorable). The video clips

The Price is Right for Confidence Intervals Read More »

Activity: Evaluating Statistical Information: Product Selection

This activity gives students practice evaluating statistical information by placing them in the role of a therapist who needs to purchase software for her practice. It also helps show students the value of understanding concepts from research/statistics in contexts other than doing research. This activity should take approximately 15-20 minutes. Students could work individually or

Activity: Evaluating Statistical Information: Product Selection Read More »

Lab Activity: How Does Novelty Impact Food Enjoyment? (t-test for Independent Means/Samples)

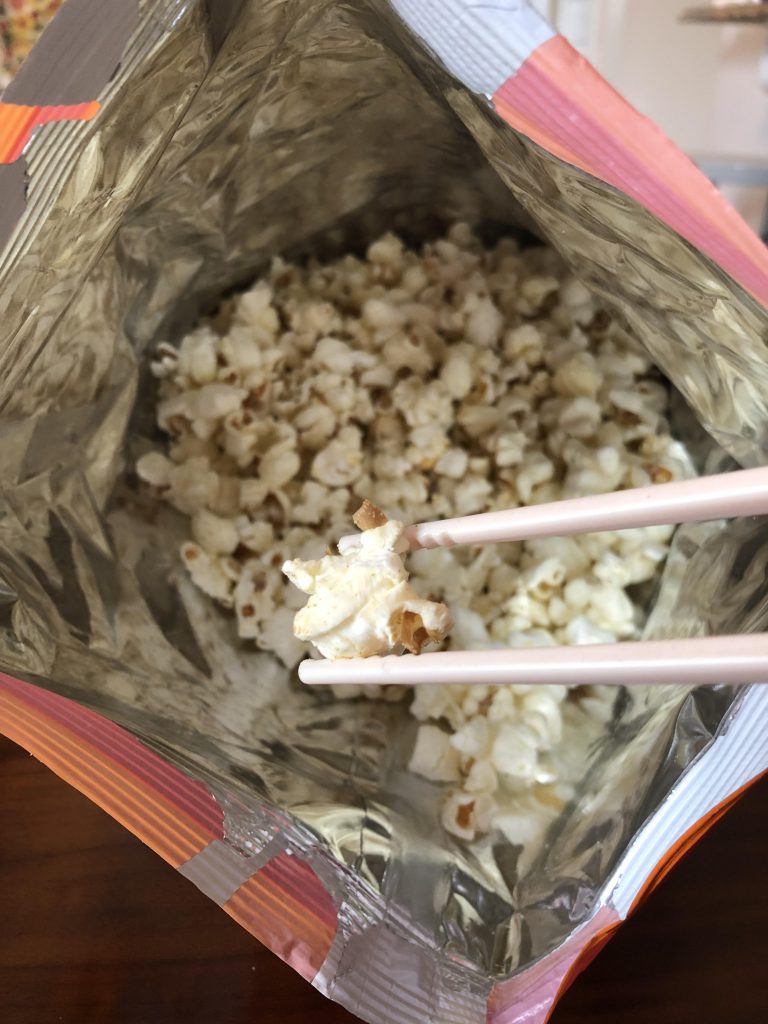
In this activity (created by Dr. Eliane Boucher), students will participate in a simplified version of the first study conducted by O’Brien and Smith (2019). In this study, participants were instructed to eat a familiar food (popcorn) in a conventional or an unconventional way (with chopsticks). Participants then rated how enjoyable the food was (note

Lab Activity: How Does Novelty Impact Food Enjoyment? (t-test for Independent Means/Samples) Read More »

Lab Activity: Caramel Apples and the single sample t-test (SPSS)

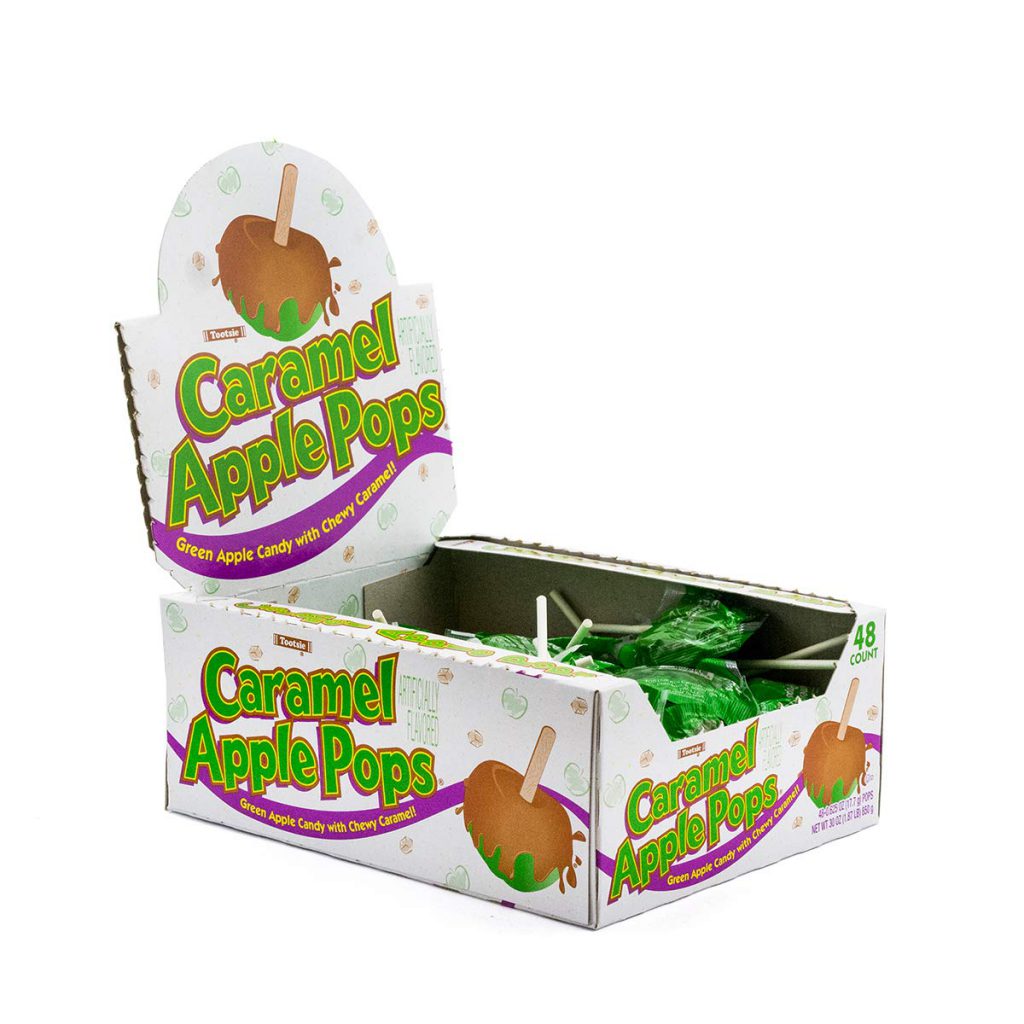
This is an activity (created by Dr. Maya G. Sen) that has has students collect data that they analyze (by hand and with SPSS) using a single-sample t-test. They compare the weights of a sample of Caramel Apple Pops to the population mean (i.e., the advertised weight). Materials NeededEnough Caramel Apple Pops for everyone (including

Lab Activity: Caramel Apples and the single sample t-test (SPSS) Read More »

How Going Online Can Benefit Students

In the article “Thinking about a Gap Year”, Dr. E. Michele Ramsey reviews research that “…gives us insight into how students can benefit from learning to successfully navigate college online during Covid-19 when being on campus just isn’t a great idea.” Essentially, learning to learn online provides students with the opportunity to cultivate many employable

How Going Online Can Benefit Students Read More »

Link: High Quality Instruction Post-COVID

From the site: The playbook provides a path for continuous improvement of instruction along a quality-oriented continuum.  Design guides immediate and basic needs for moving a course online. It is useful for translation of face-to-face or blended courses for fully-online delivery.‍ Enhance provides options to strengthen the student learning experience. It is useful for improving face-to-face course

Link: High Quality Instruction Post-COVID Read More »

Exemplar Study: Do Graphic Warnings Make Cigarettes Less Cool? (Mixed Design)

This study examined the effectiveness of graphic warnings (i.e., pictures) for reducing the appeal of tobacco products. In the study, researchers exposed smokers and nonsmokers to combinations of large versus small warning labels and the inclusion versus omission of graphic pictures on three types of tobacco products. For the within-subjects component, each participant saw advertisements

Exemplar Study: Do Graphic Warnings Make Cigarettes Less Cool? (Mixed Design) Read More »

Exemplar Study: Does Cuteness Make Us Careful? (Mixed Design)

This article examined how the perception of cuteness influences behavioral carefulness, enhancing people’s ability to care for infants. While researchers took physiological measures of heart activity and skin conductance, they exposed participants to a slide show of pictures of either infant animals (kittens and puppies) previously judged as very cute or adult animals (cats and

Exemplar Study: Does Cuteness Make Us Careful? (Mixed Design) Read More »

Exemplar Study: Can You Accurately Judge Romantic Interest? (Mixed Design)

This study sought to determine whether a third party could discern romantic interest between two strangers. To test this, male and female observers watched video clips of speed-dating situations to determine the individual speed dater’s level of romantic interest toward the speed-dating partner. Participants observed clips of different lengths (10 vs. 30 s), and from

Exemplar Study: Can You Accurately Judge Romantic Interest? (Mixed Design) Read More »