Statistics

Open Stats Lab: Two-Way (Factorial) ANOVA Activities

Activities focus on the following topics: (TWO-WAY ANOVA) Do People Judge Physical Distances of Locations Based on Their Psychological Orientation Toward Them? Here students get to conduct a two-way (factorial) ANOVA, tests for the interaction, and create a figure. (MIXED ANOVA) Do People Underestimate the Pleasure of Remembering Ordinary vs. Extraordinary Events? Here students get […]

Open Stats Lab: Two-Way (Factorial) ANOVA Activities Read More »

Open Stats Lab: One-Way ANOVA Activities

Activities focus on the following topics: (ANOVA w/ PLANNED COMPARISONS) Does Reasoning about Personal Problems Improve with Psychological Distance? Here students get to conduct a one-way ANOVA (with planned comparisons) and create a figure. (ANOVA w/ PLANNED CONTRASTS) Can Playing Tetris Reduce the Occurrence of Intrusive Memories? Here students get to conduct a one-way ANOVA

Open Stats Lab: One-Way ANOVA Activities Read More »

Open Stats Lab: t-test Activities

Activities focus on the following topics: (SINGLE SAMPLE and PAIRED-SAMPLES) Does Music Convey Social Information to Infants? Here students get to conduct a single/one sample t-test, a t-test for dependent means (paired samples), and can create a boxplot and/or scatterplot. (TWO INDEPENDENT SAMPLES) Do Spoken or Written Words Better Express Intelligence? Here students get to

Open Stats Lab: t-test Activities Read More »

Open Stats Lab: Regression Activities

Activities focus on the following topics: Why are People Biased When Reasoning About the Status Quo? Here students get to conduct bivariate correlations, regression, and multiple regression. They may also create a table. Do Experts Overrate the Extent of Their Expertise? Here students will conduct descriptive statistics, t-tests, multiple regression, and use a split file.

Open Stats Lab: Regression Activities Read More »

Open Stats Lab: Correlation Activities

Activities focus on the following topics: Does Being Wealthy Distort Perceptions of Wealth Inequality? Here students get to create new variables, calculate means and standard deviations, and conduct bivariate correlations. Do Outbreaks of Infectious Diseases Influence Voting Behavior? Here students will need to select certain cases for the analysis, conduct bivariate correlations, and generate scatterplots.

Open Stats Lab: Correlation Activities Read More »

Link: Open Stats Lab

Open Stats Lab (OSL) is a free resource for the teaching of introductory statistics. From the site: “OSL is primarily a resource for the teaching (and learning) of statistics. Although many statistics textbooks come with supplemental data sets to help train students in data analysis, these data sets often lack the richness and complexity of

Link: Open Stats Lab Read More »

Assignment: Creating a Conference Poster on Sex Differences (SPSS)

In this assignment (created by Dr. Kimberly A. Barchard and Dr. Leiszle Lapping-Carr), students conduct a literature review, analyze data using an independent samples t-test and a confidence interval, create a grouped frequency distribution and a histogram, write a research report, and create a PowerPoint poster. A detailed grading rubric is included. This assignment was

Assignment: Creating a Conference Poster on Sex Differences (SPSS) Read More »

Video: Chi-Square Calculation

A short (~5 minute) video (created by J David Eisenberg) with straightforward examples and explanations of how to compute the chi-squared statistic for independent measures of nominal data. Examples focus on who uses a garbage can vs. who litters, among males and females. Another example focuses on the color of fliers and whether people take

Video: Chi-Square Calculation Read More »

Video: Sampling Distribution of the Sample Means

A Khan Academy video that demonstrates calculating means of samples in the context of the central limit theorem, including a discussion of the Sampling Distribution of the Sample mean (or the Distribution of Means of Samples). You can find the whole series of Khan Academy videos on Probability and Statistics here.

Video: Sampling Distribution of the Sample Means Read More »

Video: Introduction to Hypothesis Testing

A really well done video that clearly explains the basics of hypothesis testing. Students could easily watch this at home as part of a flipped classroom approach and come to class with a solid foundation. It has over 2 million views for a reason. This video is from the http://www.MathTutorDVD.com series.

Video: Introduction to Hypothesis Testing Read More »

Lecture Slides: Power and the Elephant (Understanding the Relation Between Sample Size, Effect Size, and Significance Level)

This activity (created by Dr. Lisa Dinella) has students participate in a lively game show that serves as a metaphor for the relation between sample size, effect size, and significance level when determining power The goal of this is to provide students with an example that demonstrates the interrelation of effect size, significance level, and

Lecture Slides: Power and the Elephant (Understanding the Relation Between Sample Size, Effect Size, and Significance Level) Read More »

Lecture Slides: Predicting Job Performance (Multiple Regression)

This is an example (created by Dr. Alisa McArthur) looking at predictors of job performance that shows simple multiple regression using SPSS which illustrates how multicollinearity can lead to results that are inconsistent and difficult to interpret. It includes both a PowerPoint as well as hard copy for students to help them get more comfortable

Lecture Slides: Predicting Job Performance (Multiple Regression) Read More »

Stats in Everyday Life: Z-scores and the Top 20 Athletes Ever

“Top” lists of anything are always popular because people want to see how the list compares to their own beliefs. Readers then get to debate the merits of who was included or excluded. When it comes to a diverse group such as athletes, it can be difficult to compare across sports. Please click here for

Stats in Everyday Life: Z-scores and the Top 20 Athletes Ever Read More »

Lecture Slides: Samples Representing the Population with the Use of M&Ms

This PowerPoint leads students through an activity that stresses the need to have a relatively large sample when trying to accurately represent the population.Instructors will need to supply students with fun size bags of plain M&Ms®. Students first estimate the population frequency of each color of candy using their small sample (fun size bag). Then

Lecture Slides: Samples Representing the Population with the Use of M&Ms Read More »

Activity: Orange You Glad for Descriptive Statistics?

This is a lab or classroom activity “Oranges Are the New Statistics“(created by Kathrine Frey Frøslie) that has students peel oranges and collect data from various aspects of the experience (e.g., number of wedges, speed of peeling, weight of oranges, etc.) Students then use this data to calculate descriptive statistics such as central tendency, and

Activity: Orange You Glad for Descriptive Statistics? Read More »

Online Activity: Simulation of Sampling Distributions

This Java applet (created by Dr. David Lane) estimates and plots the sampling distributions of various statistics based upon the user’s specified population distribution, sample size, and statistic. The simulation and its associated questions can be used as either homework assignment or as an in-class activity for those classes with access to computers with Internet

Online Activity: Simulation of Sampling Distributions Read More »

Link: FiveThirtyEight.com’s Hack Your Way to Scientific Glory

This website lets you take the wheel and play with several different parameters during data analysis. By defining who you’re sample is, how you measure economic performance, an what other variables you factor in, you’ll get to see how it impacts results. Sure enough, after a few tries you’re virtually sure to get “publishable” findings.

Link: FiveThirtyEight.com’s Hack Your Way to Scientific Glory Read More »

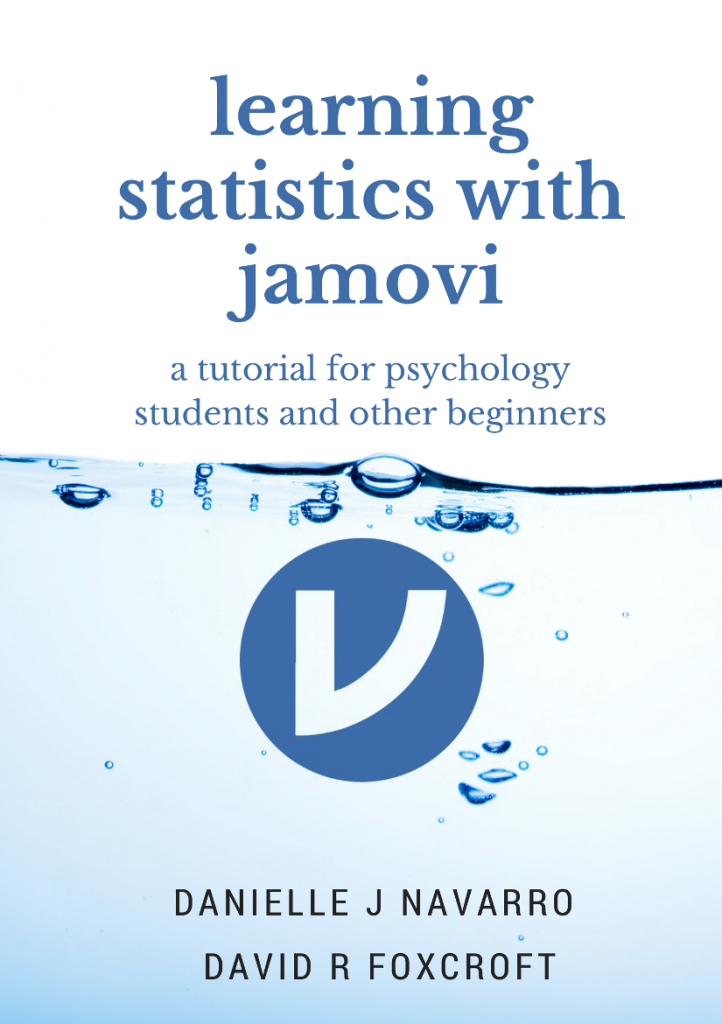
Resource: Learning Statistics with JAMOVI

This is a very basic/brief statistics textbook by Dr. Danielle Navarro and Dr. David Foxcroft. It includes an easy to follow section on using JAMOVI with instructions and screenshots. If you’re new to JAMOVI this is a fantastic resource. Please click here for the free file. To download JAMOVI, click here.

Resource: Learning Statistics with JAMOVI Read More »

Link: Society for the Improvement of Psychological Science (SIPS)

From The Society for the Improvement of Psychological Science (SIPS) Mission Statement: The Society for the Improvement of Psychological Science (SIPS) brings together scholars working to improve methods and practices in psychological science. Anyone interested in improving psychological research is welcome to join, regardless of experience. SIPS is a service organization aiming to make psychological science higher

Link: Society for the Improvement of Psychological Science (SIPS) Read More »

Online Activity: Open Science in Psychology

A set of lecture slides (created by Dr. Benjamin Le) entitled, “Open Science in Psychology: Why, What, & How.“ This stylish slide deck reviews the problem (i.e., the replication crisis) including several examples of failed replications, questionable research practices, and provides potential solutions (e.g, using open science concepts). Please click here for the file.

Online Activity: Open Science in Psychology Read More »